7 Training sessions
7.1 Training sessions
In the same way that Standard Area Diagrams (SADs) can improve the accuracy of visual estimates of disease severity, exposure to a diverse set of diagrams or actual images with known severity values can significantly enhance a rater’s assessment proficiency. The key to this improvement is the frequent exposure to various levels of severity, which enables the rater to better calibrate their judgments over time.
As the rater engages with these reference diagrams or images, they develop a mental model of the severity scale. This mental model is continually refined through repeated exposure to a variety of severity values. This iterative learning process allows the rater to adjust their estimations based on the feedback from known values, thus improving their overall accuracy and precision in disease severity estimation.
Such a process, often termed ‘training’, is particularly beneficial in scenarios where visual estimation is the primary tool for assessing disease severity. Training raters using sets of reference images is an effective strategy to enhance inter-rater reliability and consistency over time, especially when coupled with other tools like SADs.
7.2 Software
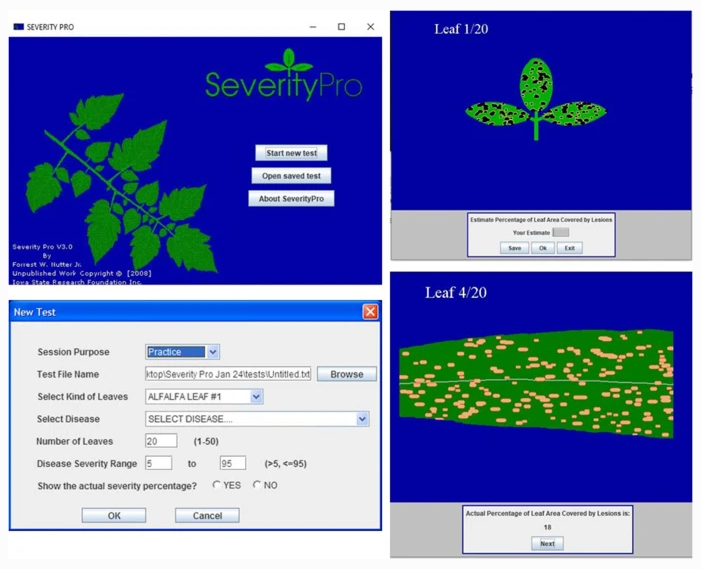
Indeed, the use of computerized training sessions in assessing disease severity has a rich history, dating back to the mid-1980s when personal computers were first introduced. These early applications were developed using operating systems like DOS or Windows and involved software like AREAGRAM, DISTRAIN, DISEASE.PRO, ESTIMATE, SEVERITY.PRO, and COMBRO. These programs utilized computerized images with specific and measured disease severities to train raters, as outlined in the review by Bock et al. (2021).
The main advantage of these computerized training sessions is that they allow raters to familiarize themselves with various disease severity levels, thereby enhancing their performance in severity estimation. Such training has been proven to significantly improve the accuracy and consistency of disease severity evaluations.
However, a potential limitation of this approach is the short-lived nature of the benefits derived from such training. The skills and proficiency gained from these computerized training sessions may degrade over time, necessitating regular retraining for raters to maintain their performance level. This could be due to the fact that estimation skills, like many other skills, require regular practice for maintenance. Without ongoing exposure to severity scales and continued practice, the accuracy and precision of a rater’s estimates may decline.
To address this challenge, it would be beneficial to implement a structured training regimen that includes regular retraining sessions. This could help ensure the continued proficiency of raters in estimating disease severity, thus maintaining the accuracy and reliability of assessments over time. Furthermore, it would be advantageous to investigate the optimal frequency and structure of these training sessions to maximize their effectiveness and sustainability in the long term.
7.2.1 Online training tools
In Brazil, the “Sistema de treinamento de acuidade visual” was initially developed as a web-based system to train raters in assessing citrus canker. The system has evolved over time and now has a current version that is accessible on both iOS and Android platforms. You can find the current version of the system at this link. This platform provides an interactive training experience to enhance the ability of raters in accurately assessing the severity of citrus canker.
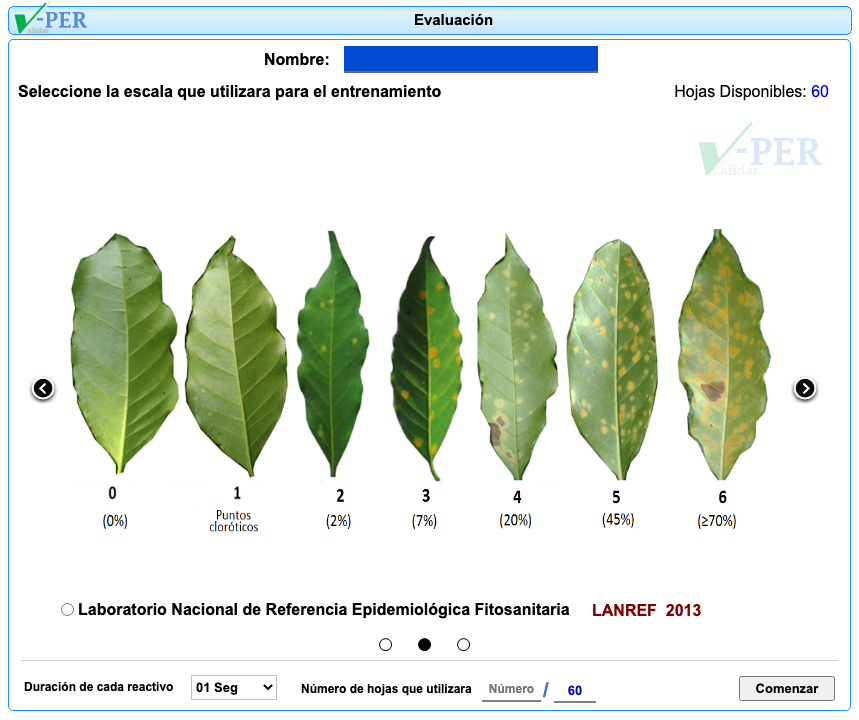
In Mexico, a specific application called Validar-PER has been developed to train raters in visually assessing the severity of coffee leaf rust. This application utilizes diagrammatic log-based scales as a standardized approach for severity assessment. You can access the Validar-PER application online here. The application aims to improve the proficiency of raters in evaluating the severity of coffee leaf rust using a systematic and standardized methodology.
7.2.2 Training software made with R
7.2.2.1 TraineR
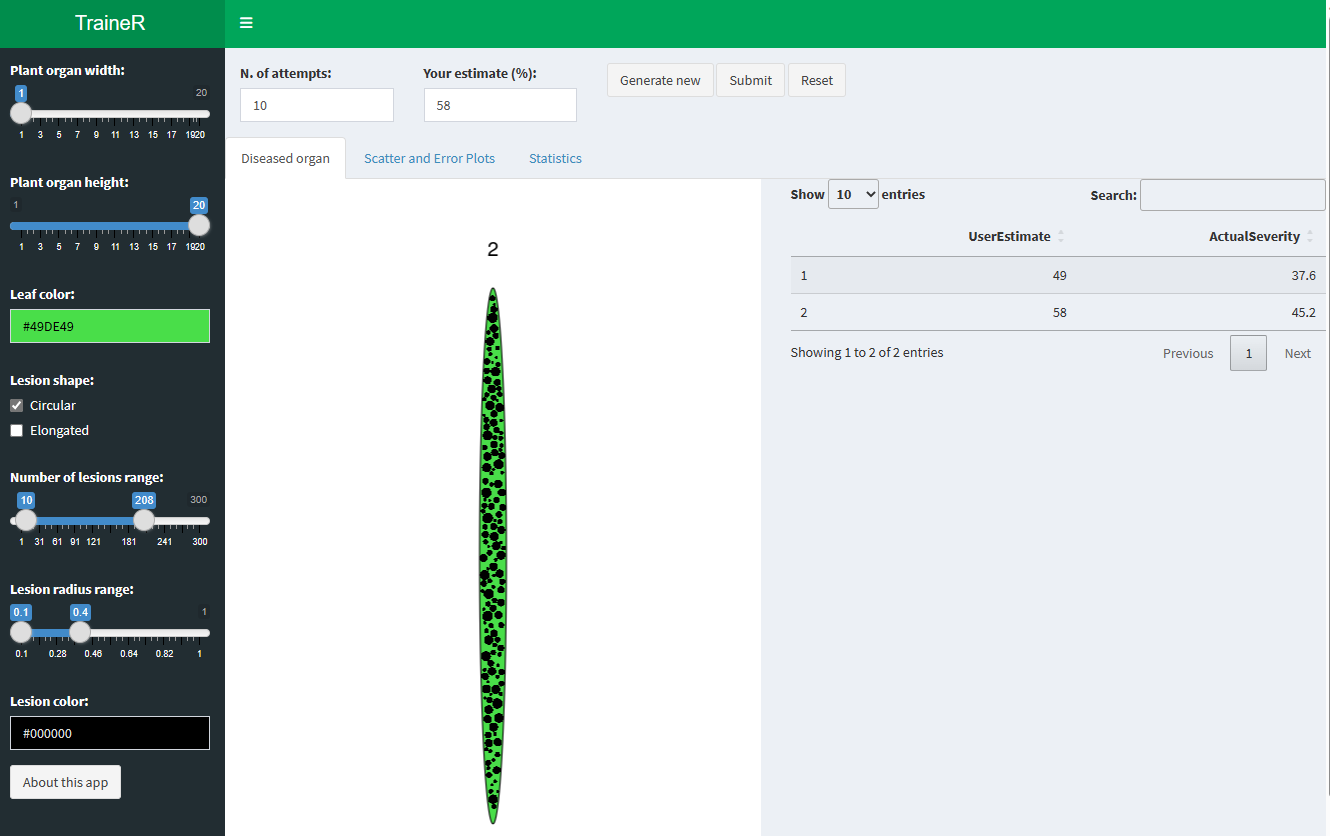
TraineR, developed by the author of this book, is created using R and Shiny. Its purpose is to train users in assessing disease severity, specifically expressed as the percentage area of an organ (leaf or fruit) affected by lesions.
To use the app, users can adjust parameters for organ shape, organ color, as well as lesion shape, lesion color, lesion number, and lesion size. These adjustments will generate a standard area diagram with an ellipsoidal shape.
To initiate the training, users should first set the desired number of attempts for the session and click on the “generate new” button. A diagram will then be displayed, and users should input their estimate of the diseased area as a numeric value in percentage. The estimate will be recorded and shown in a table along with the actual value, enabling a comparison between the actual and estimated values.
Users can continue generating new diagrams and providing estimates until they reach the defined number of attempts. Once the final attempt is completed, the app will present the accuracy in the form of Lin’s concordance correlation coefficient to the user. Plots depicting the relationship between estimates and actual values, as well as the error of the estimates, will be displayed. Furthermore, comprehensive accuracy statistics are also made available.
Currently, the app has certain limitations, including the inability to overlap lesions and a maximum severity representation of approximately 60%. Nonetheless, it remains a valuable educational and demonstration tool.
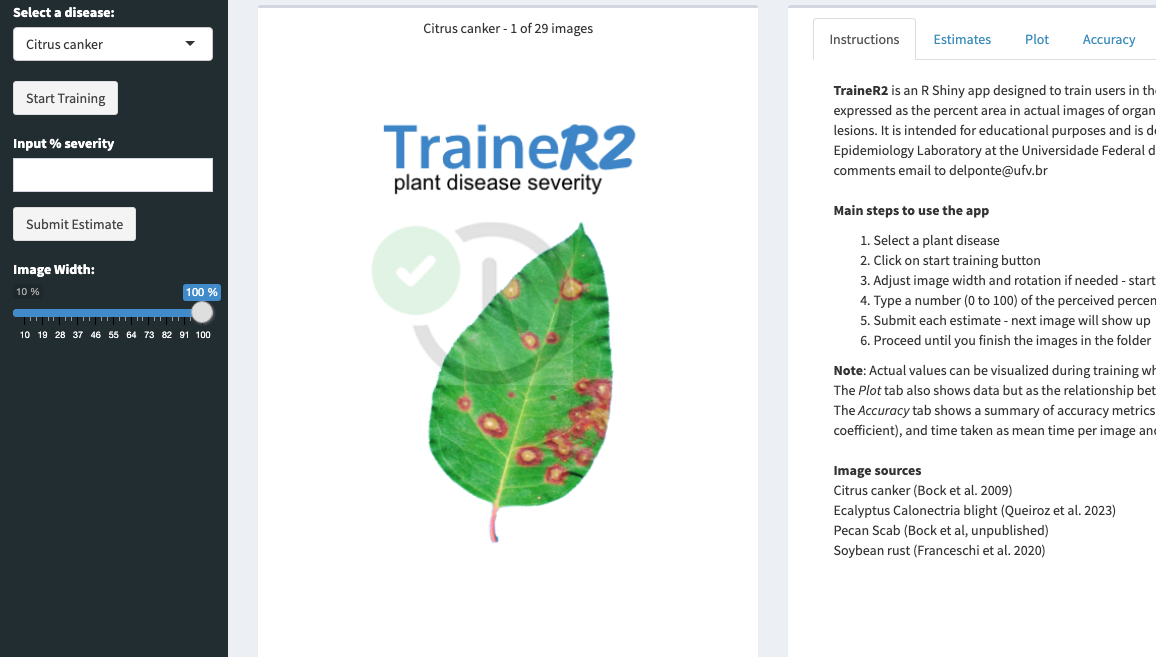
7.2.2.2 Trainer2
Trainer2 the second generation of TraineR, takes advantage of actual photographs showcasing disease symptoms. This updated version allows for testing the ability of raters to assess disease severity, particularly by evaluating the percentage area affected based on real symptoms captured in the photographs.
By utilizing actual images, Trainer2 offers a more realistic and practical approach to training raters. Raters can now evaluate disease severity by visually inspecting the symptoms depicted in the photographs, enhancing their ability to accurately assess the extent of damage in terms of the affected area.
The incorporation of real symptoms in Trainer2 serves as a valuable tool for evaluating and refining the skills of raters in disease severity assessment. It provides a more authentic training experience and helps raters become proficient in identifying and quantifying the extent of disease based on visual cues observed in real-life scenarios.